How much does Flexibump reduce speed?
We’ve often been asked this question – and now we finally have the answer.
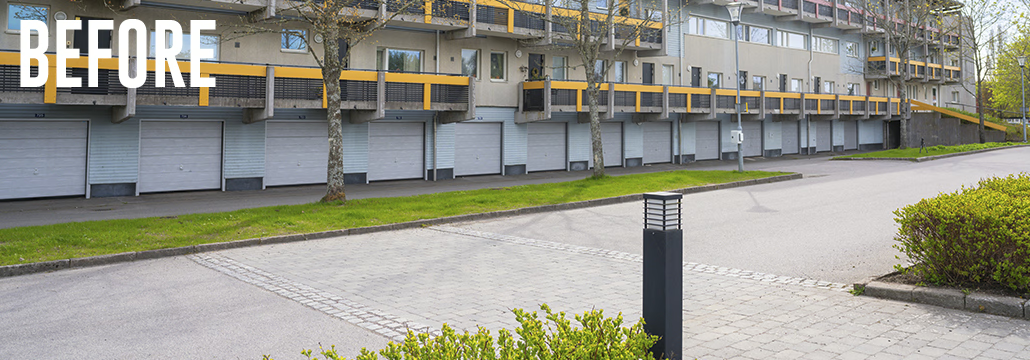
The road where the tests were carried out had long struggled with reckless driving at high speeds. The concrete speed bumps that had
been placed to create a chican had not delivered the desired results. That’s why we started a collaboration with the property owner to
find a more effective solution.
We identified a suitable location for the measurements – a section of the road with the highest traffic volume and generally high speeds.
First, we conducted measurements with no speed bumps at all to establish the baseline. Over nine days, we recorded both the number
of vehicles and their speeds.
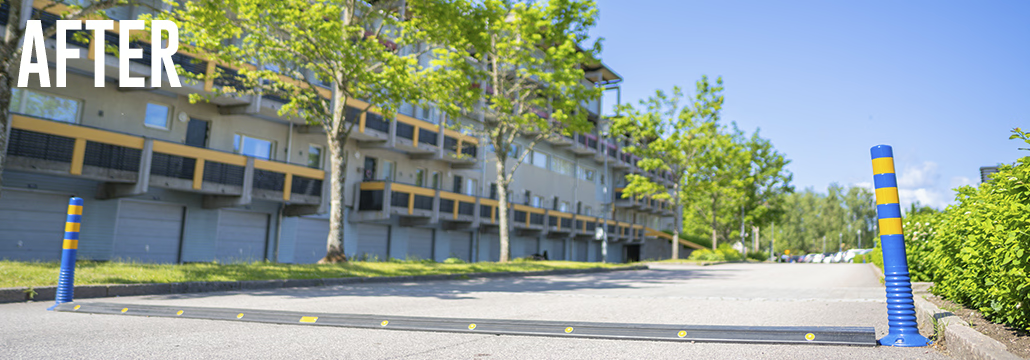
After the initial test period, we installed our Flexibump at the same location and carried out new measurements.

Before Flexibump
(7–16 May 2025)
Average speed: 33 km/h
Maximum speed: 112 km/h
Vehicles exceeding 70 km/h: 13
Total: 2055 vehicle passages

After Flexibump
(26 May–4 June 2025)
Average speed: 22 km/h
Maximum speed: 107 km/h
Vehicles exceeding 70 km/h: 4
Total: 705 vehicle passages
The average speed decreased by 11 km/h.
This makes a difference. Research shows that even small reductions in speed save lives:
Read the article at Forskning.se
Want the same effect where you live or work?
👉 Check out Flexibump

