Polar diagrams
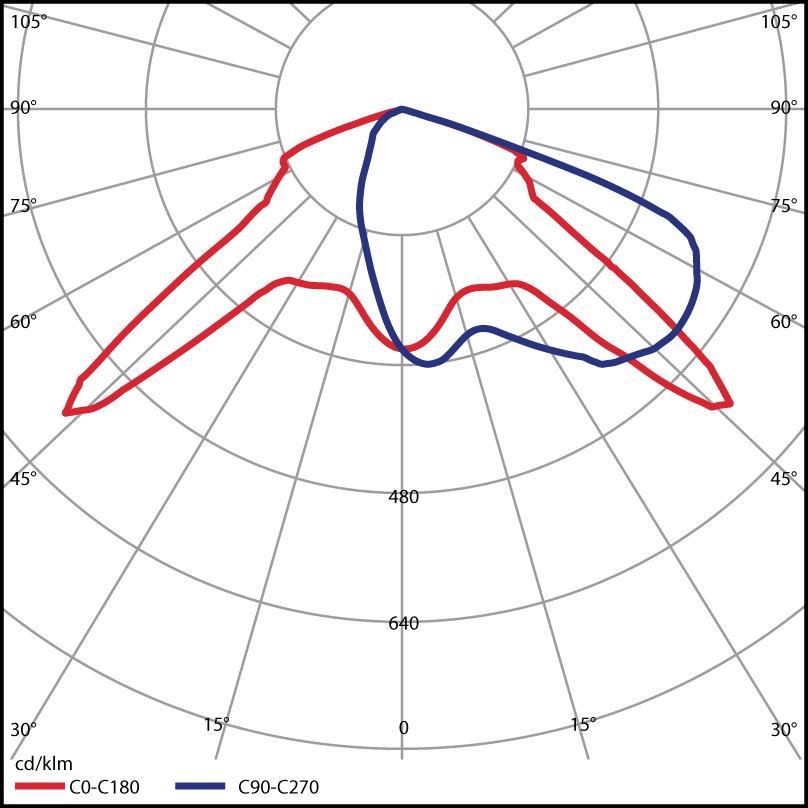
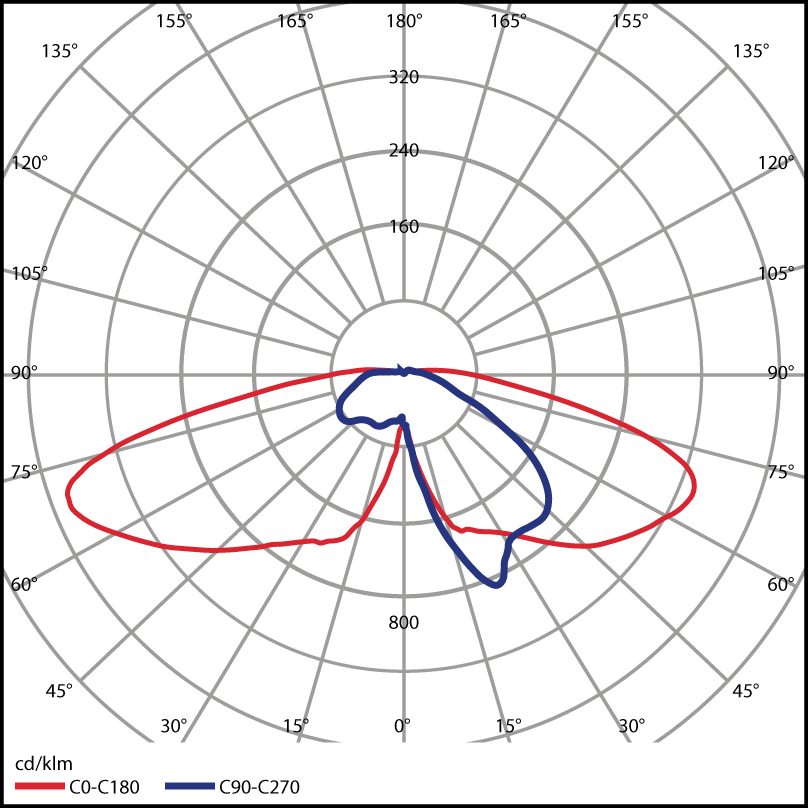
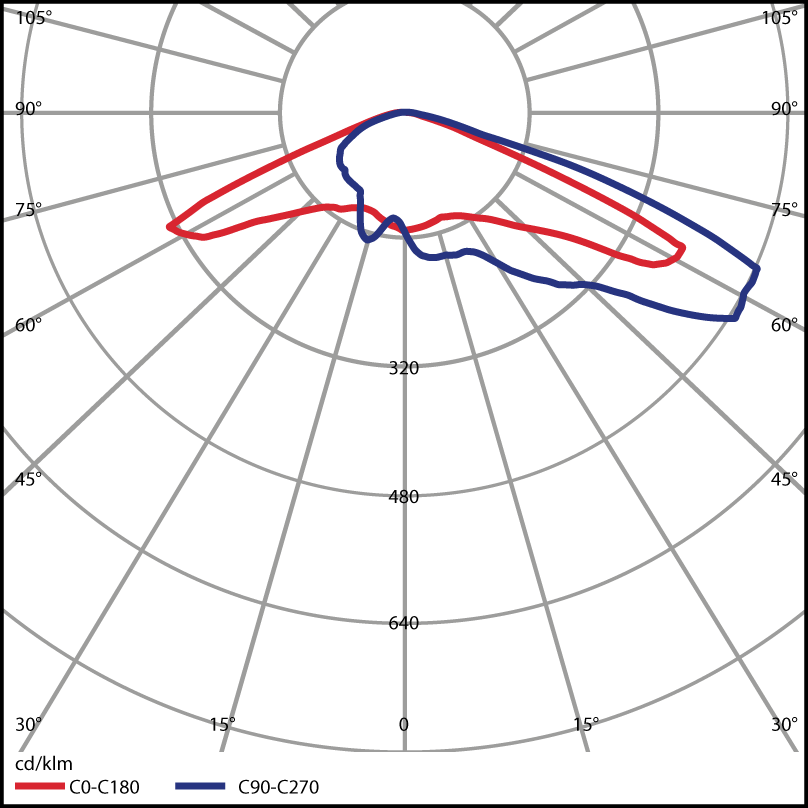
Polar diagrams are a type of diagrams that show the intensity of a force in different directions, 360 degrees
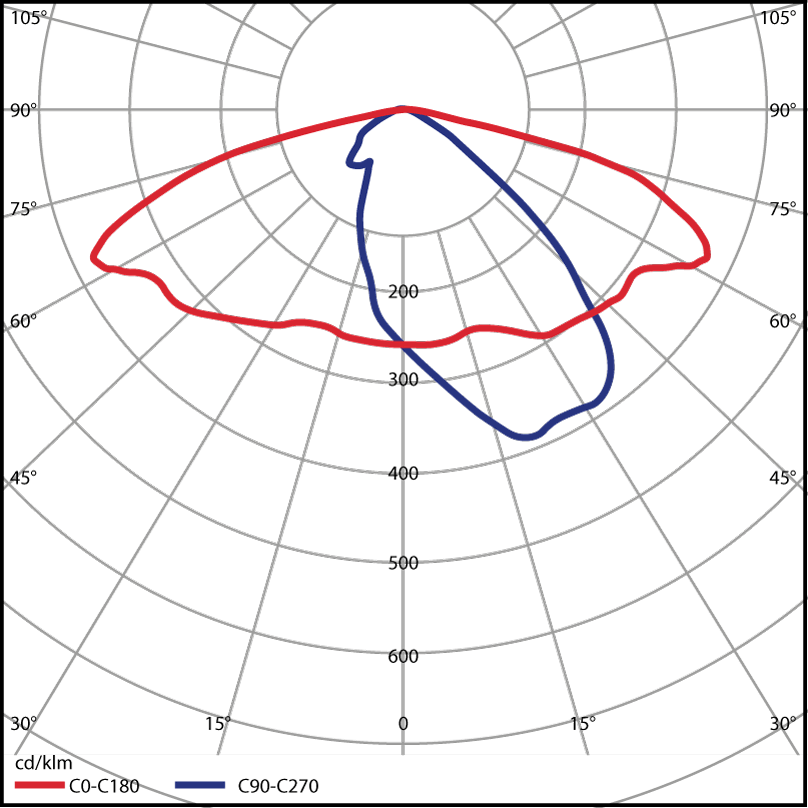
An example of usage is illustrating the luminous flux in a certain direction from a light source, where the intensity is measured in candela (cd) or kilolumen (klm). The light data, in the shape of a LDT-file, is used in light calculation programs such as DIALux.
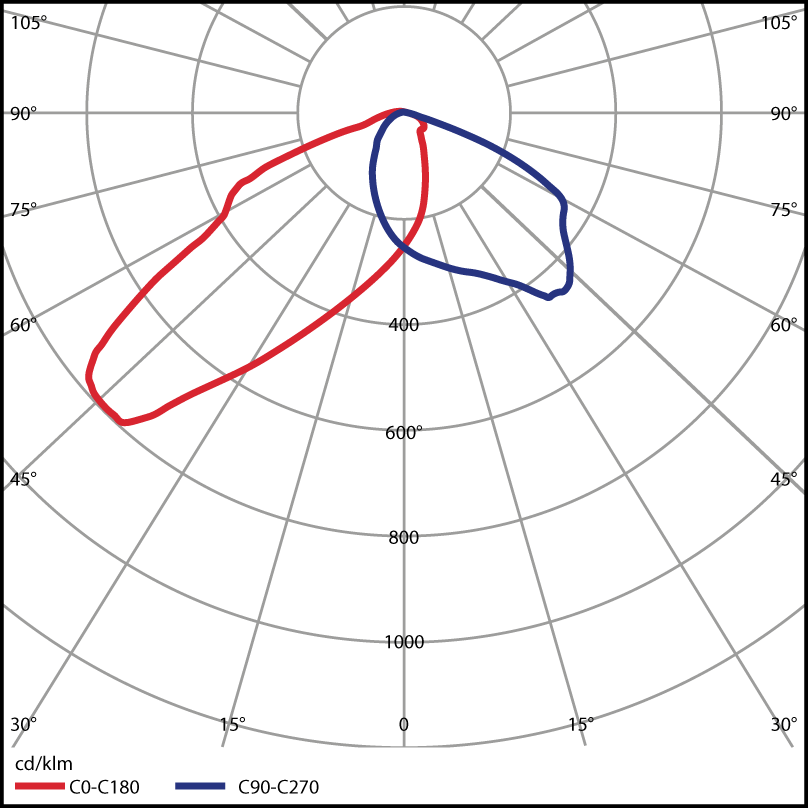
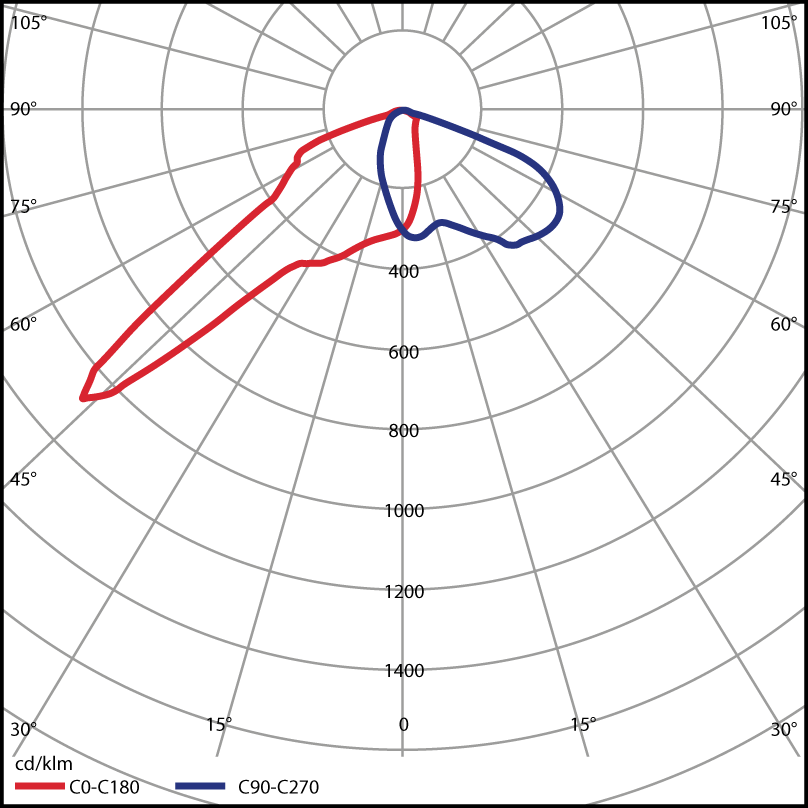
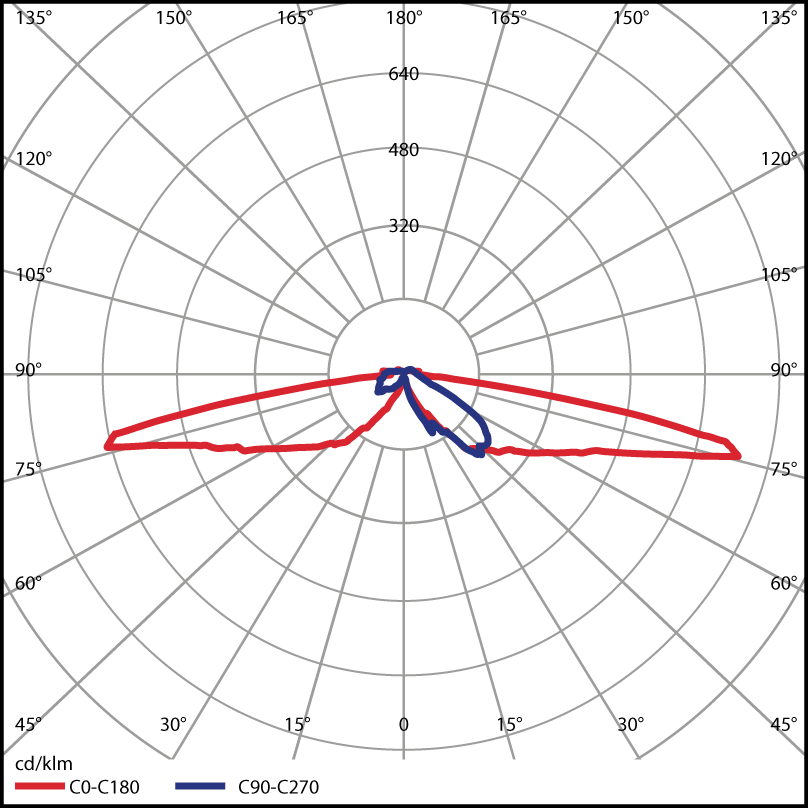
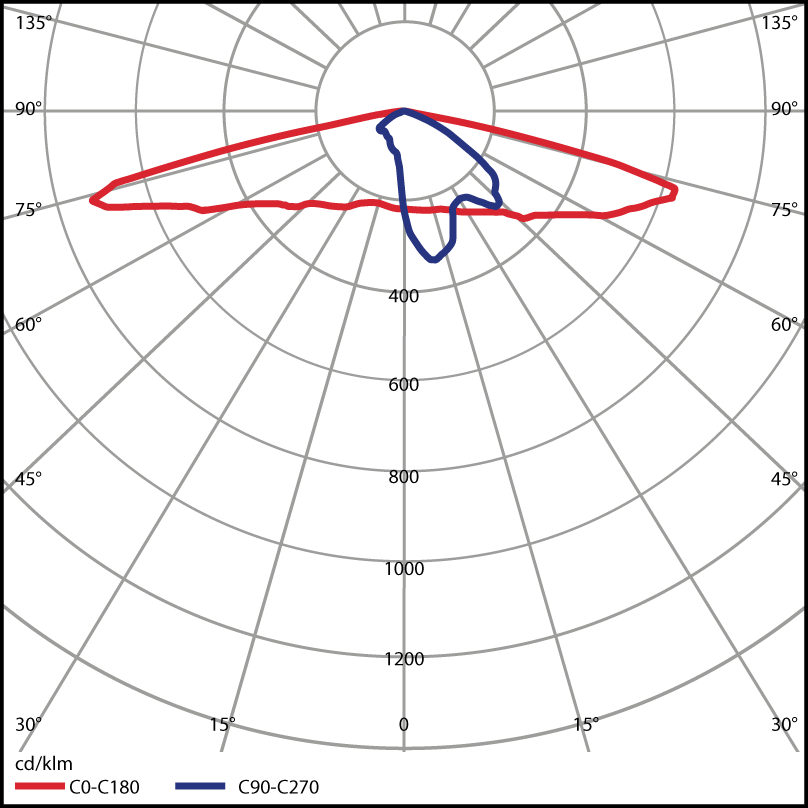
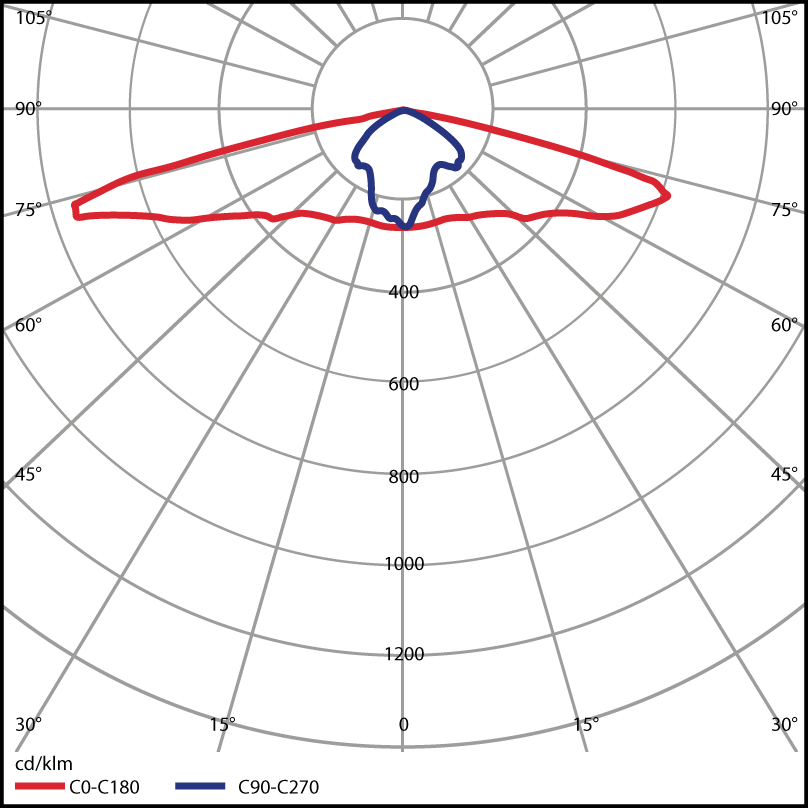
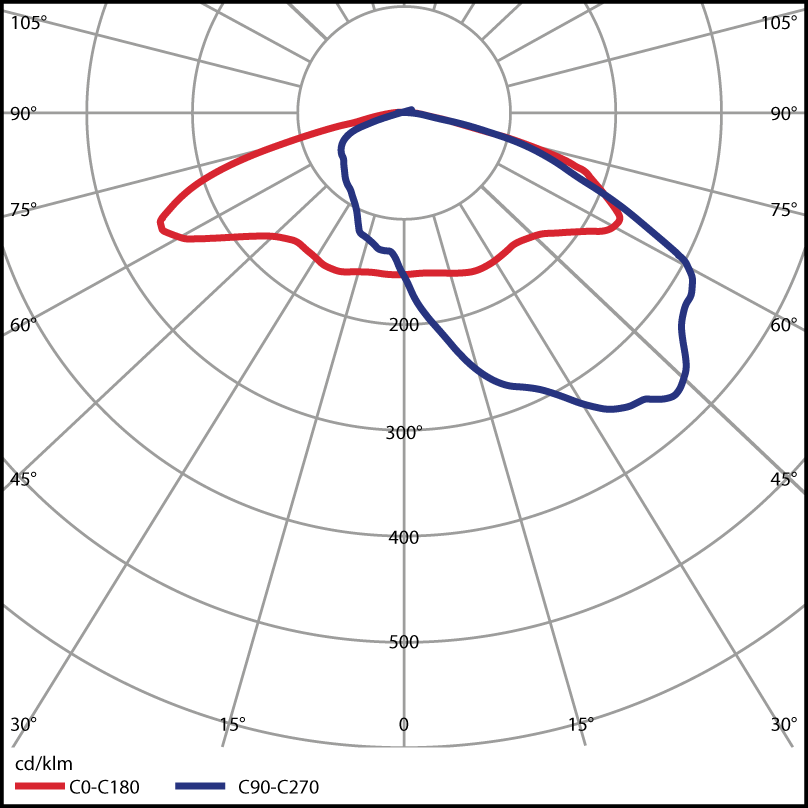
Lenses, lens combinations
The light distribution varies depending on the lens used, and this is depicted through polar diagrams. Below are polar diagrams for our different fixtures and lenses. Note, however, that the polar diagrams for different models may vary slightly. This applies, for example, to Prisma Light Eliott 4-16 and Prisma Light Eliott 4-32. Therefore, the information below works as an indication.